It’s a familiar New York scene: A driver pulls into a bus lane “just for a minute,” hazards blinking, maybe to grab a bagel or drop off a package. Behind them, a bus full of riders sits stuck, waiting for the lane to clear. Multiply that by dozens of cars and thousands of trips, and you’ve got one of the biggest headaches in urban transit: blocked bus lanes.
That’s where the MTA’s Automated Camera Enforcement (ACE) program comes in. ACE uses bus-mounted cameras that quietly record vehicles blocking lanes or stops to keep buses moving.
This fall, those cameras—and the violations they capture—took center stage at the CUNY Macaulay Honors College Datathon. There, hundreds of CUNY students spent a week diving into the Automated Camera Enforcement Violations open dataset, turning raw records into stories about bus speeds, hotspots, and what’s changing on the routes they ride every day.
More than 80 teams worked online with supporting MTA datasets before 20 finalists gathered in person at Macaulay’s building in Manhattan. Huge thanks to Professor Allen Hillery, who led the datathon, and Macaulay Computer Science Club President Maryam Ilyas, who kept everything running.
From camera to open data
Before we dive into the student projects, a quick bit of context.
ACE began as Automated Bus Lane Enforcement (ABLE) in 2019, when cameras on 123 Select Bus Service routes in Manhattan and Brooklyn flagged repeat lane blockers for review, with a 60-day warning period before fines of $50–$250 kicked in. The program expanded in 2020 to crosstown routes and, by 2022–23, gained broader authority to address bus stops, double-parking, and related violations across all five boroughs. In 2024, with hundreds more equipped buses, ABLE was rebranded ACE—now one of the largest bus camera enforcement efforts in the country.
So, what actually happens after a bus camera spots a car in the lane?
The camera captures the vehicle and license plate, then sends the information to program partners for review, verification, and collection.
That’s where MTA Open Data comes in. Once the violations are finalized and shared back with the MTA, our team processes them into a public dataset. The Open Data documentation explains in more detail how we are mapping stops with each violation, including how some occurrences may or may not result in a violation and the reason why.

ACE in the classroom
This fall, CUNY Macaulay Honors College students put ACE data to the test in a datathon. Their prompts included:
- Comparing enforced vs. unenforced routes for bus speed improvements.
- Looking at how congestion pricing intersects with ACE enforcement in Manhattan.
- Mapping exempt vehicles to see where they most frequently block buses.
For many students, these datasets aren’t just abstract numbers—they reflect the very buses they rely on to get to campus. It’s exciting to see open data used in ways that connect directly to daily life.
We had about 20 presentations from students across different CUNY colleges, along with two high school participants who joined in as well. The day started with some much-needed coffee, and then we went straight into student presentations—one team after another sharing creative, data-driven takes on how ACE is shaping commutes in their city. We were lucky to have one of the judges to be from the MTA team, Hannah Spierer, helping evaluate the projects and keep the energy high throughout.
Team spotlight 1: Data Sultans
Data Sultans focused on CUNY-serving routes and built clear metrics to show changes in travel speeds after ACE. Looking at pre- vs. post-ACE periods on routes that serve CUNY campuses, the student team found that average speeds rose from about 7.6 mph to 8.3 mph after enforcement went live—an encouraging signal that keeping bus lanes and stops clear helps students get to class on time.

Team spotlight 2: Team DJI
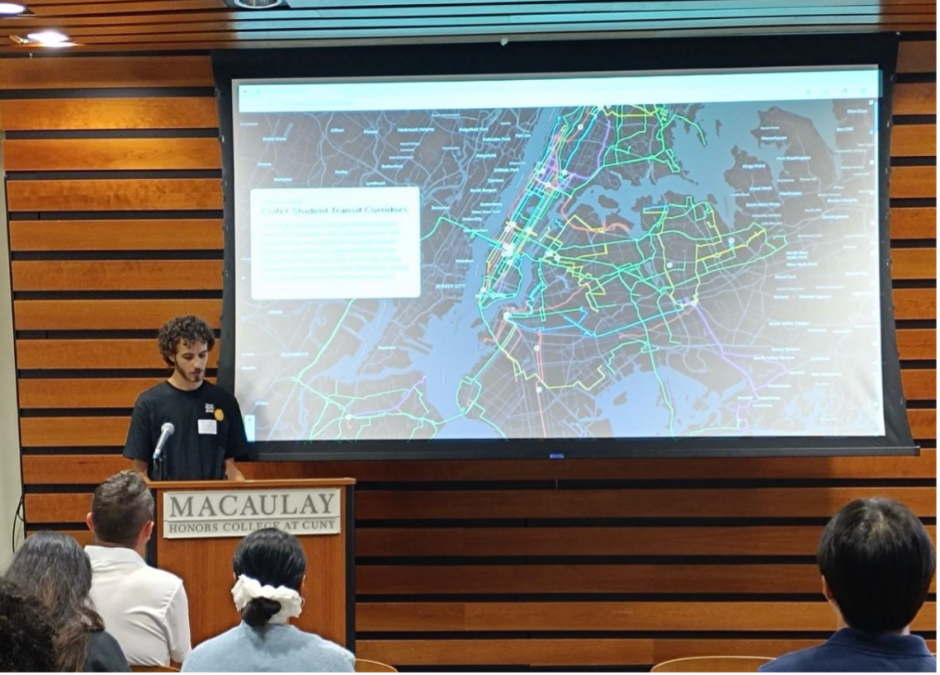
Jonah Moskal (team DJI) created an interactive website that layers urban infrastructure (street layout, land use, major facilities) on top of ACE violations to explore where and why hotspots emerge. He also examined the introduction of congestion pricing, finding a notable decrease in violations on a majority of affected routes—suggesting policy and enforcement can work hand in hand to keep buses moving.
Team spotlight 3: Mind the Data Gap
The winning team—Syeda Rahman, Salma Ghaeth, and Alishya Loyd—dug into exempt vehicles on the M101 and grounded their analysis in place: hospitals, police precincts, commercial zones, and street geometry. Around Amsterdam Av and 175 St, the team zoomed into specific blocks and used ACE data to pinpoint where violations clustered. By layering in street context, they identified nearby EMS facilities and dense commercial corridors, to understand “how violations occur in that area,” as Syeda put it. Alishya said working with ACE data helped her “see where the violations are,” while Salma emphasized that the MTA publishes granular, public datasets that people can use to answer everyday questions—like “why is my bus late?”

A shout-out
This open dataset wouldn’t exist without Hongying Wu, who built it during her internship with the MTA Open Data team. She pulled raw enforcement data, structured it for publication, validated the fields, and documented it so anyone could understand and use it. Her work is what makes all of these insights—and the student projects—possible.
Get involved
The ACE dataset, along with hundreds of others, is available at data.ny.gov.
If you’re a student, a researcher, or just a New Yorker with a curious streak, dive in! Map a route you ride. Look for hotspots in your neighborhood. Or just explore the trends.
And if you find something interesting in the data, we’d love to hear from you—email us at opendata@mtahq.org.
About the author
Rahnuma Tarannum is a data scientist on the Data & Analytics team, focusing on open data.