We’ve all been there. Maybe you’re headed to the US Open, maybe you’re headed home after a Mets Game, or maybe you’re on your way into work during the morning peak. All you know is that your legs are tired, all the seats are full, you feel no shared humanity with the other riders occupying your personal space, and you’re tired of doing the full-car shuffle as more and more passengers crowd onto an already packed train.
When your car on a Long Island Rail Road train is full, it’s easy to lose hope. You may have an hour-plus trip ahead of you, and it looks like you’ll have to endure it on your feet. In these circumstances, what can a commuter do?
First, you could take an unoccupied middle seat; choosing to stand when there are seats available slows boarding and makes it harder for conductors to collect tickets. But if the middle seats are full, you can use the power of open data to make informed choices about what car you ride in and maximize your chances of getting a seat on an otherwise full train.
The MTA’s Open Data Team publishes two datasets on LIRR occupancy: one at the trip level and one at the stop level. Occupancy estimates are derived from loadweigh air pressure sensors on M7 and M9 trains; these sensors communicate the weight aboard the train along the train’s journey, and Long Island Rail Road Service Planning uses this data in conjunction with other datasets to estimate the number of passengers departing each stop on each trip.
As well as passengers departing each stop, the stop-level dataset includes two columns estimating the number of passengers occupying each car at each stop and the capacity of each car, in order from the front of the train to the back. We can use this data to determine which cars you should seek out if you want to grab a coveted (window or aisle) seat.
A detour: How often are the trains crowded anyway?
Before we dig into the stop-level data, though, you might be wondering: How often are LIRR trains crowded? On the railroad and in life, bad experiences tend to stick in our memory, while the mundane passes us by.
Using SoQL with the LIRR trip occupancy dataset, we can get a sense of how often we experience the type of crowding that brings us too close to our fellow traveler. The chart below bins the maximum-occupancy of LIRR trips within 10-percentage-point buckets, for M7 and M9 trains in 2024. Despite what it may seem like, of the 238,638 trips for which we had loadweigh data, only 1.6% of trips were at least 80% full at their maximum load point and only 0.5% of trains were at least 90% full.
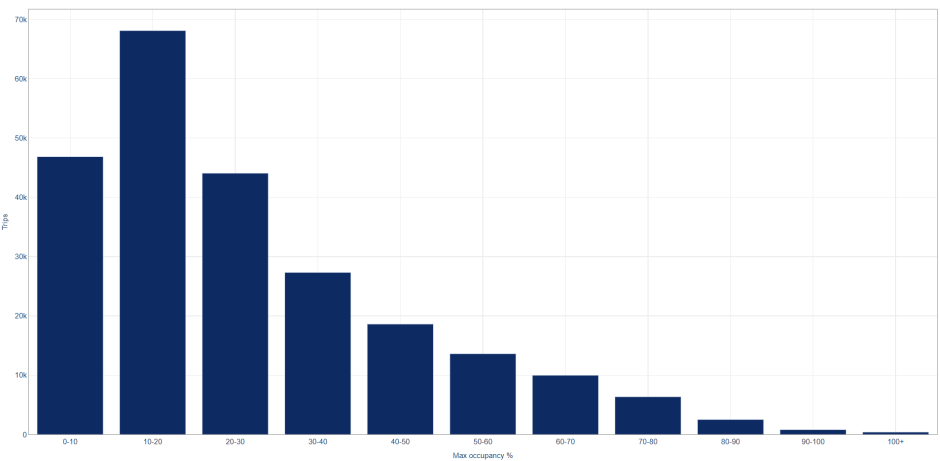
It’s worth emphasizing that this data reflects occupancy at the maximum load point—the stop with the most passengers on each trip. Even using this conservative estimate—conservative because a train might only be near-capacity for one or two stops along a journey—it’s rare for a train to exceed 90% capacity. This data does just include M7 and M9 trains (because other types of trains don’t have loadweigh sensors), but there isn’t reason to think this general pattern of crowding would differ for other trains.
Why might impressions of train crowding diverge from reality? Crowded trains, by definition, carry more people. So, while only a small percentage of trains may be crowded, a larger percentage of riders experience crowding. If one train carries 990 people and another carries 10, only 50% of trains are crowded, but 99% of passengers are on the crowded one. You could be riding the railroad at times when it’s more likely to be crowded (for example, in the morning and evening peaks or to and from big events). Some passengers avoid taking the middle seat of three, leaving the impression a train is full when middle seats are still available. And some passengers will use a seat as a baggage holder, artificially limiting capacity.
Finally, you may be riding in cars that tend to be more crowded. Which brings us to…
Digging into car-level passenger count data to find out where you should board
To determine what cars on a train are the least and most crowded, we want to take a dataset that’s at the stop and trip level; turn it into a dataset at the car, trip, and stop level; and assess differences in car-crowding by their position on the train. Before we even begin working with the data though, we should think about what data we want to work with; i.e., what filters we want to apply to the data, and how we want to inspect the data:
- We’ll work with 2024 data, to have a sample over a year.
- We’ll filter out rows where any car reports
Nullpassenger counts. Sometimes, loadweigh sensors on a car don’t work. - We’ll filter out stops with a passenger count of less than 200 passengers. We’ll play around with this threshold later, but finding a less crowded car is only a problem when the train is crowded.
- We’ll filter out 6-car trips. These are pretty rare, and crowding by car varies less than other consist lengths.
- We’ll break the data out by direction and consist length (number of cars). As a strategic, anti-social rider, we’ll want to know what car decision to make under what circumstances.
The LIRR stop occupancy dataset stores passenger counts as an array, meaning one value for one row will contain a list of values representing the passengers in each car. Or at least the data is meant to be stored as an array; unfortunately, because Socrata doesn’t have an array type, this column gets parsed as text that kind of looks like an array instead. E.g., what should be stored as [45, 52, 45, 38, 38, 41, 45, 35, 41, 35] gets stored as "['45' '52' '45' '38' '38' '41' '45' '35' '41' '35']". Fortunately, through some standard if awkward text transformations, we can get this back into a form where we can exploit the range of functions that different programming languages make available to work with arrays; in our case, to explode the dataset into one row per car per stop on a trip, with data on the passengers in that car and the capacity of the car. You could do some of this using SoQL upon reading in the data, but we chose to use the Python polars package; to see what we did, you can check this GitHub page.
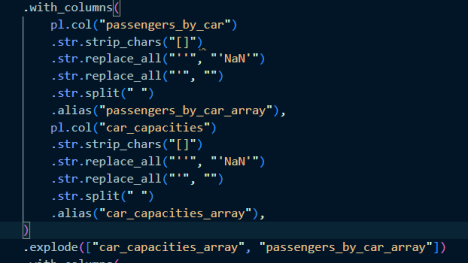
Python code snippet to turn strings representing array columns into arrays.
Finding the right car
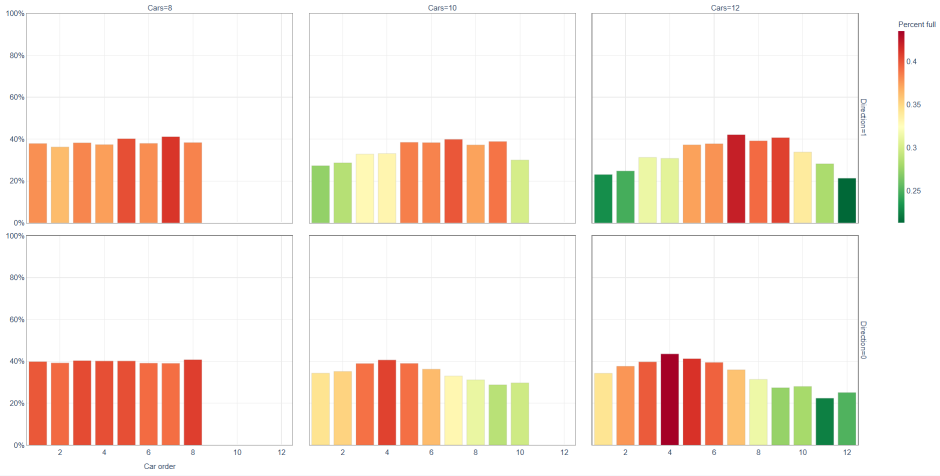
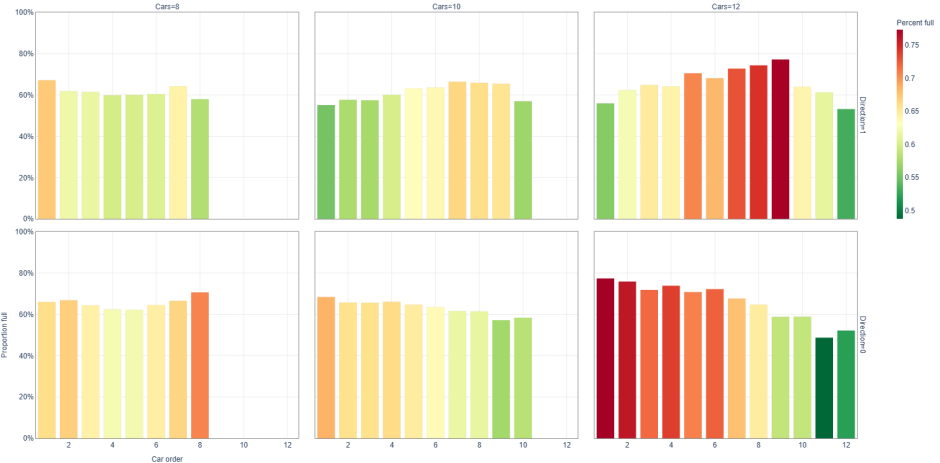
Now that we have the dataset in a form that’s easier to work with, we can calculate how full each car is and start aggregating the data to see how this holds over all 2024 trips. The chart below shows the mean occupancy percentage for stops with at least 200 passengers by order of cars, broken out by consist length and direction (1 = inbound, 0 = outbound).
What jumps out?
- There’s more variation the longer the consist; for inbound trips, there’s only a 5% difference between the most and least-crowded inbound car on an 8-car train; a 12% difference on an 8-car train; and a 21% difference on a 12-car train.
- Inbound trains are least crowded at the front and rear; cars 1-2 and 10 for 10-car consists, and cars 1-2 and 11-12 for 12 car consists.
- Outbound trains are least crowded at the rear; cars 9-10 for 10-car consists, and cars 9-12 for 12-car consists.
- Cars are most crowded in the middle. For inbound trains, cars 5-9; and for outbound trains, cars 3-6.
- Relatedly: between 10- and 12-car trains, cars in the same absolute position are similar in their level of crowding, even though their relative position within the consist has changed. E.g., car 9 in a 10-car train is similarly crowded on inbound 10- and 12-car trains, even though there’s only one remaining car in a 10-car consist and three in a 12-car consist.
This is helpful; we have some basic guidelines to follow when we’re looking for a less crowded car. But does anything change if we look at the circumstances when we most want to get away from other people; i.e., if we restrict our sample to stops with at least 80% crowding?
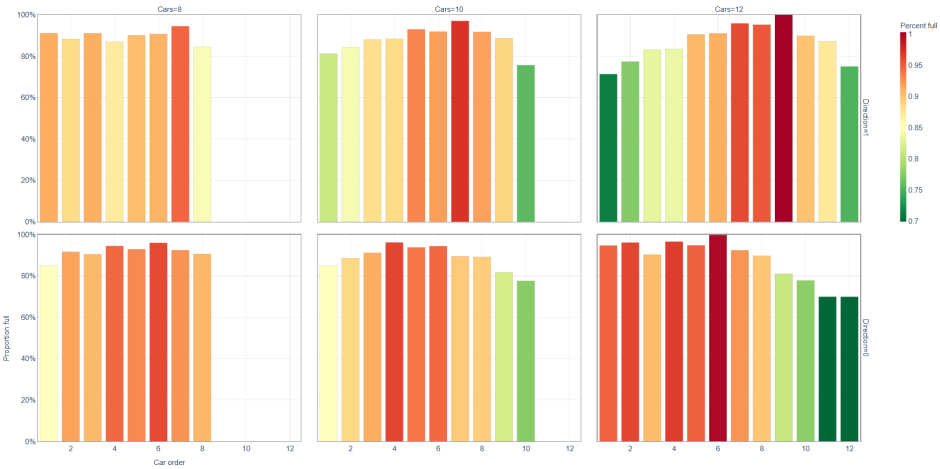
The same trends hold: The front and back of the train are least-crowded on inbound trains, and the back least-crowded on outbound trains. But the profit to be made by switching cars has increased; there’s now a 22% difference between the least and most-crowded car on an inbound 10-car trip, and a 29% difference on an inbound 12-car trip. Even on inbound 8-car trips, a 10% occupancy difference emerges between car 7 and 8, although there’s less of a clear heuristic to follow. And the most dangerous cars (to your personal space) become clearer: Avoid car 9 on inbound 12-car trains, car 7 on inbound 10-car trains, and car 6 on outbound 12-car trains.
Finally, let’s take a look at two of the most crowded stops in the system: Penn Station and Jamaica. When you’re boarding at Penn and at least half the train is full, where should you board?
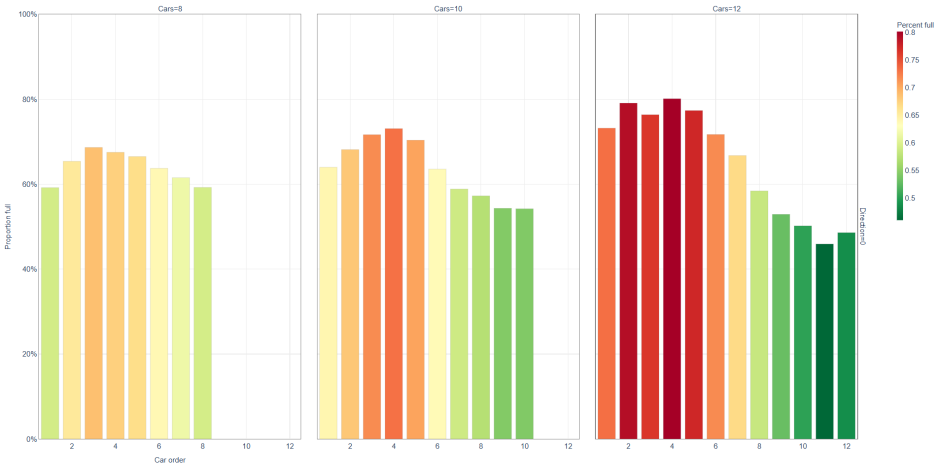
The same trends hold as usual for outbound trains, except the benefits of boarding towards the rear and away from the front-middle are more exaggerated. On average, passengers in car 11 ride comfortably with just 46% of the car full, while passengers in car 4 experience 80% crowding (including all outbound stops with at least 50% occupancy, these numbers become 47% and 71%). And what about Jamaica?
For inbound trips, the pattern at Jamaica follows the overall pattern quite closely: Shoot for the front and very rear of 10 and 12-car trains and avoid cars 1 and 7 on 8 car trains. For outbound trips, occupancy declines almost linearly from the front of the train at Jamaica, while it’s concentrated more evenly among the first 6 cars if you include all stops. So if you want to get away from your LIRR comrades, be sure to avoid the very front.
Hopefully, you now have some strategies to make your LIRR journey as comfortable as possible. And if you want some in the moment assistance, you can use the TrainTime app’s helpful color-coded crowding features to position yourself on station platforms so you can board a car with more available seats. Happy riding!
Dan Powers works on Analytics Engineering as part of the MTA Data and Analytics Team.
Think these visuals could be better? Apply to join the team as a Data Engineer focused on external-facing data visualization.