The results of the Fall 2025 Customers Count survey are in
The Fall 2025 biannual Customers Count survey was conducted from October 14 to November 2, 2025. The survey received over 92,000 respondents. We received more than 85,000 subway line, 39,000 bus route, and 2,800 Access-A-Ride evaluations from over 48,000 New York City Transit customers. The LIRR heard from over 19,000 respondents, and Metro-North from almost 18,000 as well.
The survey targeted customers who use any of our modes of transit: subways, buses, commuter rail, the Staten Island Railway, and Access-A-Ride paratransit. The survey was offered in nine languages and included a phone option.
The goal of the survey was to get feedback from our customers on their satisfaction levels and to identify changes compared to previous reporting periods. We also sought to gain a deeper understanding about key drivers of customer satisfaction that influence customer behaviors as well as feedback on their satisfaction with service, our staff, cleanliness, security, and more.
Hearing directly from our customers lets us better understand their biggest concerns and prioritize issues that we need to address, with the goal of bringing more customers back to our subways, buses, and trains.
Here are some of our findings
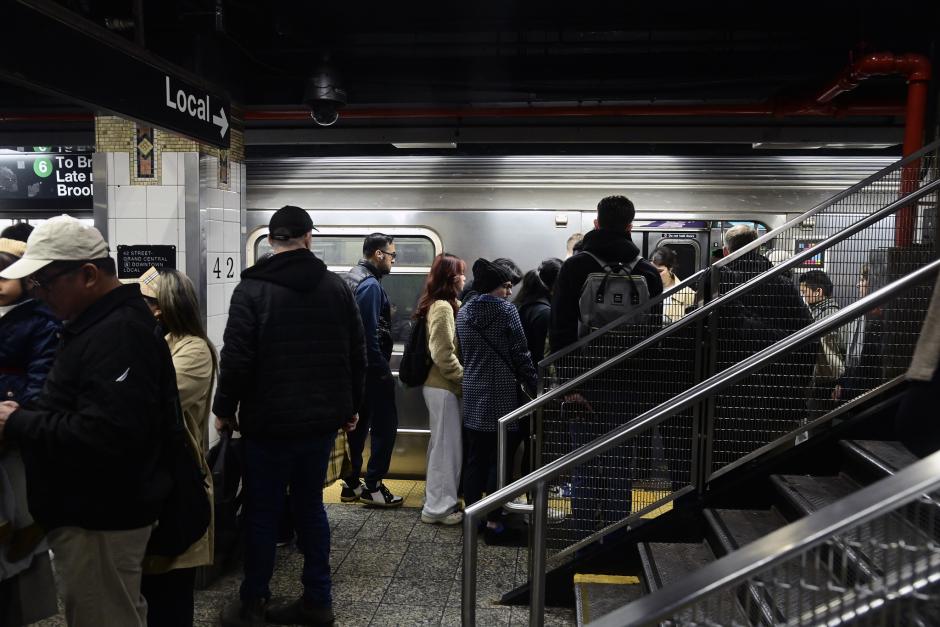
Subway
Subway satisfaction increased in the Fall 2025 Customers Count survey to 62%, a five-point increase from the Spring 2025 survey. This marks the highest level of overall subway satisfaction since the inception of this survey in Spring 2022. The increase in subway satisfaction is likely driven by gains in on-board train satisfaction, as overall line satisfaction is up four points from Spring 2025 to 65%. Nearly all on-board attributes are up, including two of the top three drivers of overall subway satisfaction: Satisfaction with service reliability, which rose two points to 62%, and satisfaction with cleanliness on board trains, which increased to 59%, a seven-point increase from Spring 2025. Other top service-related metrics also improved, with satisfaction with waiting times up two points to 59% and the frequency of delays up two points to 53%. Customers continue to feel safe in the system: 63% feel safe on trains, up six points from Spring 2025; 59% in stations, an increase of five points; and 53% on subway platforms, an increase of five points and the first time above 50% since this question was introduced in Spring 2023.
Bus
Overall Local, Limited and Select Bus customer satisfaction is 61%, down three points from Spring 2025 but still eight points higher than Fall 2024. At the borough level, satisfaction increased in Staten Island to 60%, up five points. It is 69% in Manhattan, down three points; 59% in Brooklyn and 58% in the Bronx, both down two points; and 62% in Queens, down six points. Customer satisfaction decreased slightly by one to two points in all important service-related attributes, including waiting times, travel times, service reliability, and crowding. Over the past six months, 51% of customers say they or someone they know saw a fare inspector or the NYPD enforcing fare payment.
Access-A-Ride
In Spring 2025, Access-A-Ride switched to a separate, standalone monthly survey. This allows customers to provide feedback not only about their experience over the last month, but also about their most recent trip.
Over September, October, and November 2025, overall Access-A-Ride satisfaction remained stable at 77%, comparable to April’s 79%, May’s 78%, and June’s 78% despite record-setting ridership. Customers' satisfaction with their last trip was 84% in the last three months, also consistent with 86% in April, 85% in May, and 84% in June.
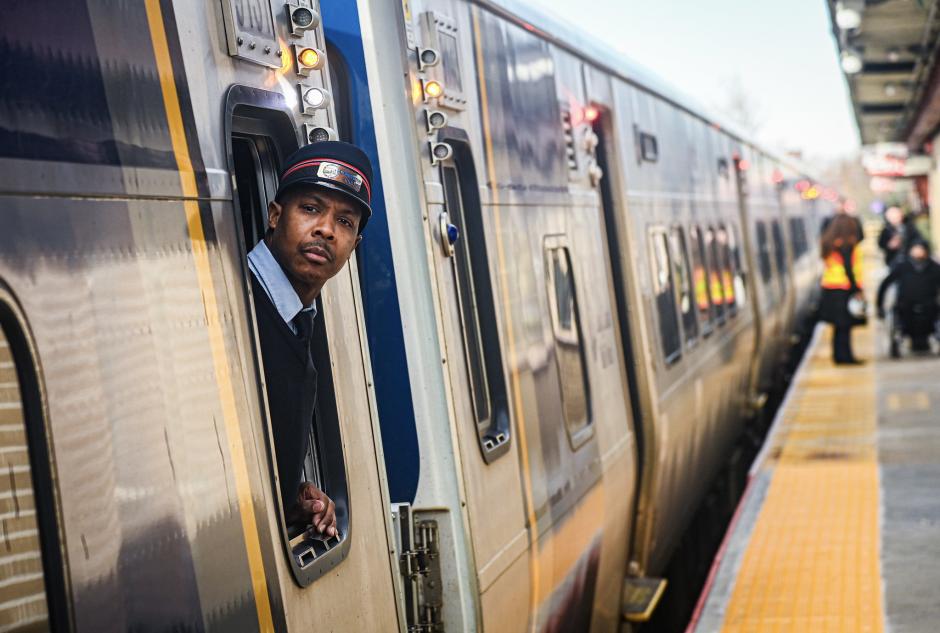
Long Island Rail Road
Customer satisfaction with the Long Island Rail Road is at 80%, a one-point decrease from Spring 2025, showing that improvements seen in the Spring have real momentum. A focus on on-time performance through Jamaica was a key factor contributing to the stability, with overall satisfaction at 68% among customers who always transfer, consistent with Spring 2025. Among all customers, satisfaction with the transfer experience is up two points to 69%, and among those who always transfer, it is up three points to 56%. Nearly all key attributes stayed consistent with the improved results seen in the Spring. Satisfaction with service reliability is 86% and with on-time performance is 83%. Satisfaction with safety also remained steady, with satisfaction with safety from crime or harassment on board remaining at 89% and in stations at 81%.
Customers continue to notice the added focus on restroom cleanliness, with satisfaction with restroom cleanliness on board remaining steady at 52%.
Metro-North Railroad
Metro-North continues to be the highest-rated agency, with 87% of customers reporting being very satisfied or satisfied with Metro-North overall, a decrease of two points from Spring 2025. The Harlem and Hudson lines were tied with the highest satisfaction at 89%, while the New Haven Line dropped three points to 86%. No key drivers had major increases or decreases in satisfaction.