This is Part 2 of a multi-part blog series. Read Part 1 and Part 3.
Welcome back to our blog series exploring the MTA’s Capital Program Dashboard in advance of the launch of our new Dashboard. In our previous post, we explored the history of the Dashboard and explained how it all started and what it can be used for. This time, we’re exploring a simple question with a surprisingly complicated answer, but one that is crucial to understanding our Capital Program and how we report capital data:
What is a project?
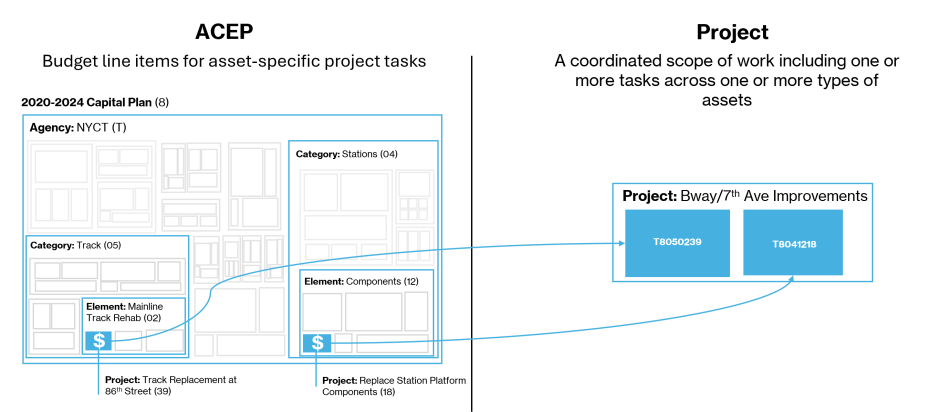
When our capital planning predecessors assembled the first capital plan in 1981, they devised what we call the ACEP coding system, which organizes our capital investments according to a hierarchy based around the Agency, Category, Element, and “Project” of our physical assets (the things we own: railroad track, elevators, bridges, etc.):
Agency: MTA agency identified with the Project budget
- Example: New York City Transit (NYCT)
Category: Agency subset, typically focused on a high-level asset groupings
- Example: Stations, within New York City Transit
Element: Category subset related to specific types of assets with similar functions
- Example: Station Elevators/Escalators, within the Stations category
Project: Basic unit of the Capital Program, reflecting work needing to be done relating to an asset
- Example: Replace 45 Elevators, within the Station Escalators/Elevators element
Each Agency, Category, Element, and Project is assigned a short-code: e.g. New York City Transit = “T,” Stations = “04,” Station Work = “12,” and Stations Renewals 10 Locations = “01.” Together with the capital plan in which the Project was committed (e.g. 2025-2029 = “9”), the short-codes are then concatenated into final ACEP codes, each referring to a unique investment: in this case, T9041201.
Example… T|9|04|07|01
| Agency | T | New York City Transit |
| Capital Plan | 9 | 2025-2029 |
| Category | 04 | Stations |
| Element | 12 | Station Work |
| Project | 01 | Station Renewals: 10 Locations |
Following the precedent established by that first capital plan, we have continued to use the ACEP structure as the basis for our reporting on capital investments. ACEP codes aren’t going anywhere, either: New York State Public Authorities Law mandates the use of the ACEP structure in submitting our five-year capital plans for approval by the Capital Program Review Board (CPRB).
By maintaining a consistent reporting structure, both the MTA and outside stakeholders can compile, analyze, and report data on specific areas of investment over time. This also allows us to easily align our reporting with partner agencies like the Federal Transit Administration, to whom we must regularly report on the status of our assets in similar hierarchies.
However, over time, we’ve found the ACEP structure to be increasingly limited in depicting what we commonly think of as a project. In the context of our Capital Program, the P in ACEP is a bit of a misnomer. Rather than ACEPs representing discrete “projects” as you might interpret the word, it would be more appropriate to think of them simply as budget line items for a task, representing an allocation of funding for work on a specific type of asset (like replacing an elevator, for example).
At C&D, our definition of a “project” is a bit broader. When we talk about projects, we’re talking about a coordinated scope of work with a set budget and timeline which can consist of one or more project tasks across one or more different types of assets. The distinction is subtle, but there's some nuance there (more on that later). For clarity, from here on when we use the term “project” we’re referring to this definition and not the ACEP conception of it.
Early on, we (particularly New York City Transit) planned a lot of projects on an asset-by-asset basis with work mostly executed within these neat hierarchical ACEP silos. At that point, a single ACEP task often did constitute the full scope of a project. A task to replace a few elevators was the full project. In a lot of cases, ACEP and project were equal, and our reporting treated them as such. When we built the first Capital Program Dashboard, we chose to report on project status, including expenditures and schedule updates, at the ACEP level.
How we do work now has shifted quite a bit, though. Over time, we’ve moved toward more strategic bundling, grouping together project tasks either by asset type (across many locations) or by corridor/geography (multiple improvements along one line). Doing work this way allows us to achieve cost efficiencies through economies of scale while reducing disruption to customers and accelerating project delivery. In 2018, for example, $1 billion in station improvements was scattered across 20 contracts. In 2022, we did more than twice the work in just 12 contracts.
Our planning has evolved, too. If we know that an asset will likely degrade into poor condition 5-10 years from now, we might split up the design component and get a head start on environmental surveys, feasibility studies, and engineering work in one Capital Plan so that when that asset comes due for replacement in the following Plan, we can jump into construction far sooner.
Functionally, this means that project scopes are more often a mashup of tasks across asset types and Capital Plans and are no longer coextensive with the task of just one ACEP. Let's look at a specific example.
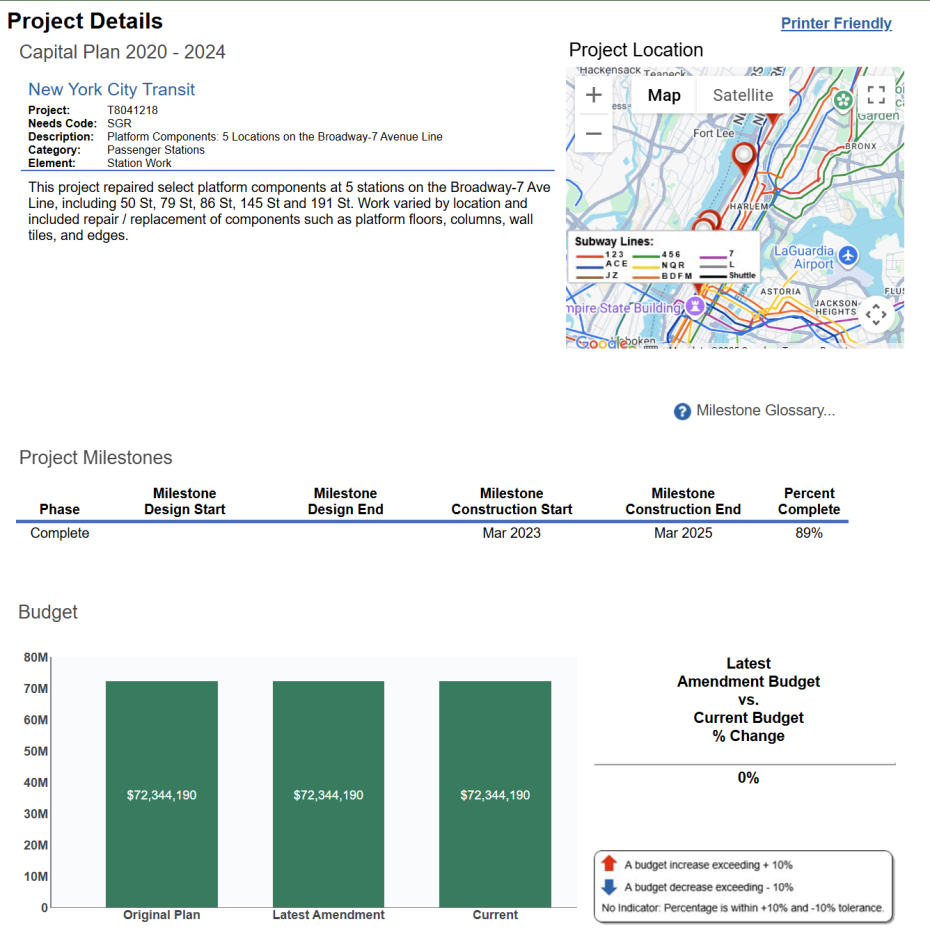
Broadway/7 Avenue Line - Platform Components and Track Replacement Project
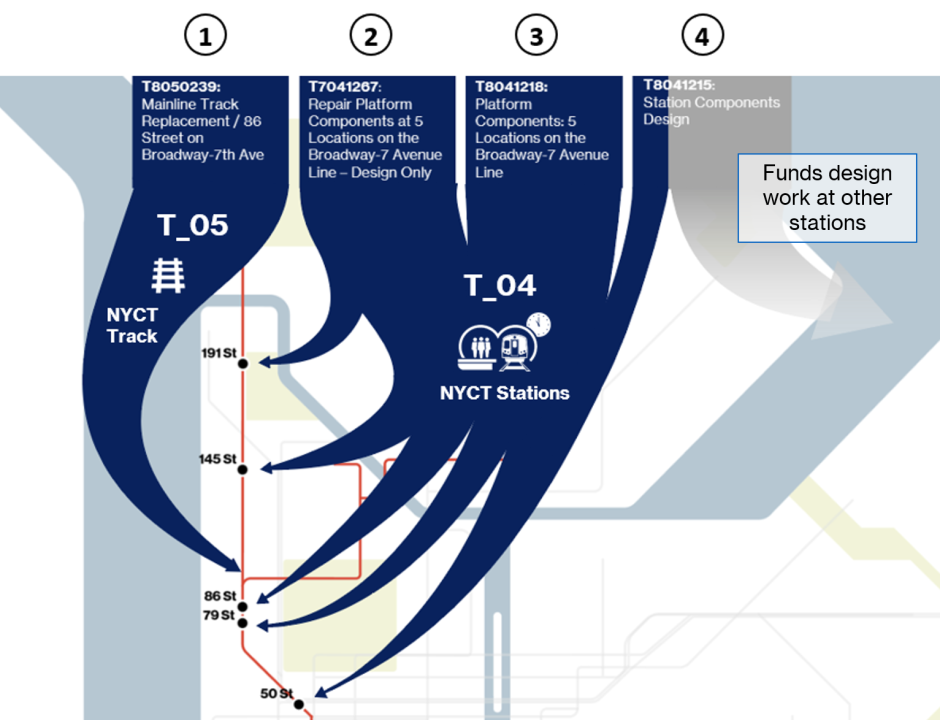
The Broadway/7 Avenue Line - Platform Components and Track Replacement project is a good example of a bundled project. It draws funding from multiple ACEP budget lines across two Capital Plans to support tasks across two different asset categories (subway stations and track). Given the close geographic proximity of stations in need of platform work and track due for replacement, this work has been bundled together into one project with a unified budget and schedule and managed by one project team, allowing us to coordinate station and track outages to reduce service disruptions for customers and save on labor costs.
- T8050239: The code for the task to replace track near the 86 Street Station on the Broadway/7 Avenue () line.
- T7041267: The code for the task to begin design work on platform structural components at these 5 stations on the line. Notice the second character is 7 and not 8 like the rest? This means this task was initiated in our 2015-2019 Plan. We split up the design and construction tasks for platform work at these stations across two plans and started work on identifying the exact components and engineering that would need to happen earlier so we could start on the work sooner in our 8th Plan (2020-2024).
- T8041218: This is the code for the task to begin construction on platform structural components at these five stations. This is the construction companion to the design task in the previous ACEP.
- T8041215: This ACEP funds a round of station component design work on another new slate of subway stations. Only a little bit of funding from this ACEP is used for this project. The emergence of COVID-19 at the beginning of the 2020-2024 Plan required us to delay and re-prioritize projects and, as a result, a small portion of this funding was reallocated for additional component design work at the five stations from the previous ACEP code. This new design work included addressing additional defects related to water intrusion that hadn’t been included in the prior design task. The rest of this ACEP funds design at several other stations, illustrating that ACEPs can provide funding to more than one project.
What does this mean for the Dashboard?
As we mentioned earlier, when we built the first Capital Program Dashboard, we reported on the status of a project (information on budget, expenditures and schedule), on an ACEP basis. This made sense given how most work was done at the time (one project, one ACEP).
If you wanted to try and understand the status of a project like the Broadway/7 Avenue Line - Platform Components and Track Replacement project using the Dashboard, though, you might have a hard time. Each ACEP has its own budget, and the milestone dates reflected are specific to the tasks funded by that ACEP.
While we see this as one project with one budget and schedule, on the current Dashboard you would have to look in four places to get the full picture.
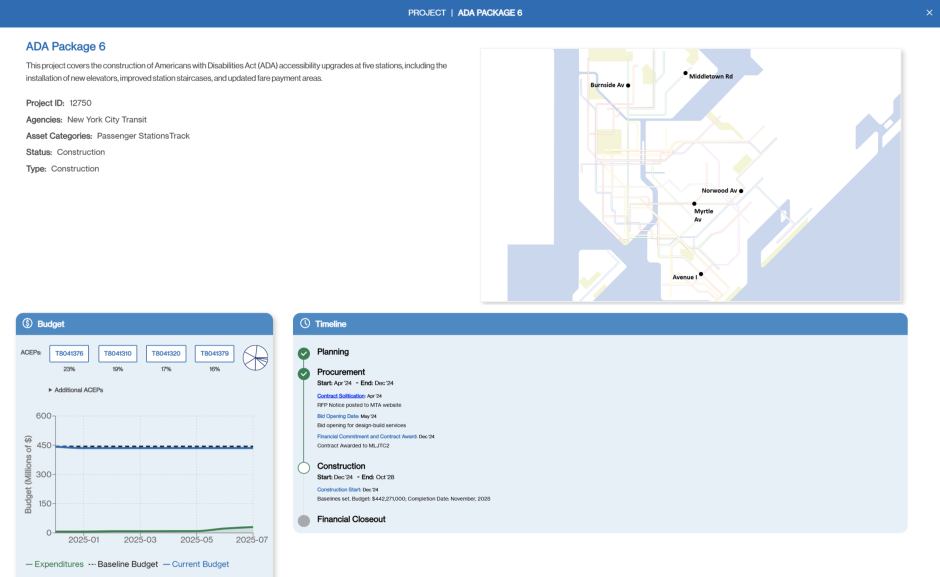
To address this, we are reworking the Dashboard to report on projects, not just ACEPs, and in doing so we’re introducing a new data structure that is more aligned with how we track projects internally. The key difference is that we will be publishing a new dataset reporting on these C&D projects, each with a primary key—the “Project ID”—which is the internal identifier we use to track them. For example, the Project ID for the Broadway/7 Avenue Line - Platform Components and Track Replacement project is 12590.
This actually isn’t a new change. We’ve been reporting on projects this way in our monthly board meetings in the Capital Program Oversight Committee books for a while now. If you look at our Business Unit project updates or the Commitments and Completions report, we’ve already been including data rolled up at the project level instead of by ACEP. To help make this distinction clearer, we will be working towards updating those materials as well to add in additional context, such as including the Project ID along with the project name, and linking to an explainer like this so that casual readers of our board materials can dive deeper if they choose to. Now, when data users try to cross-reference our board reporting with our Dashboard reporting, it should be more obvious where different budget figures are coming from.
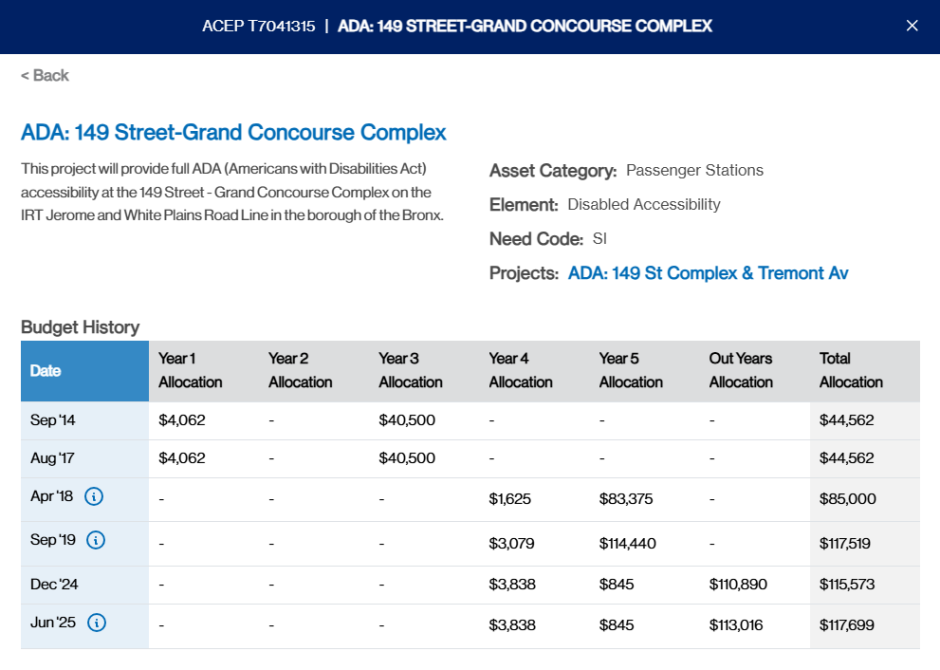
We won’t be doing away with ACEPs on the Dashboard entirely, though. Given that these are the building blocks of our Capital Program, we will retain the ability to see ACEP-level budgets and add in links to projects that they fund. However, we will no longer be reporting on project milestones or percentage complete on an ACEP basis, as that may cause confusion. Those updates will now be given at the project level. See below for a sneak preview of mock-ups for the new project and ACEP pages and how they will link together to give the full picture of the project development process.
Now that you know the difference between ACEPs and projects, stay tuned for our next post on how we’re working to improve the user interface of the Dashboard, including a refreshed map, a responsive design, and new filters and views.