The results of the Spring 2026 Customers Count survey are in
The Spring 2026 Customers Count survey was conducted from April 13 to May 2, 2026. The survey targeted customers who use any of the MTA's modes of transit: subways, buses, commuter rail, the Staten Island Railway, and Access-A-Ride paratransit. The survey was offered in nine languages and included a phone option.
The survey received almost 92,500 respondents. We received more than 92,000 subway, 45,000 bus, and 1,500 Access-A-Ride evaluations. The Long Island Rail Road heard from over 17,000 respondents, and Metro-North Railroad from nearly 16,000.
The goal of the survey was to get feedback from our customers on their satisfaction levels and to identify changes compared to previous reporting periods. We also sought to gain a deeper understanding about key drivers of customer satisfaction that influence customer behaviors, as well as feedback on their satisfaction with service, our staff, cleanliness, security, and more.
Hearing directly from our customers lets us better understand their biggest concerns and prioritize issues that we need to address, with the goal of bringing more customers back to our subways, buses, and trains.
Here are some of our findings
Subway
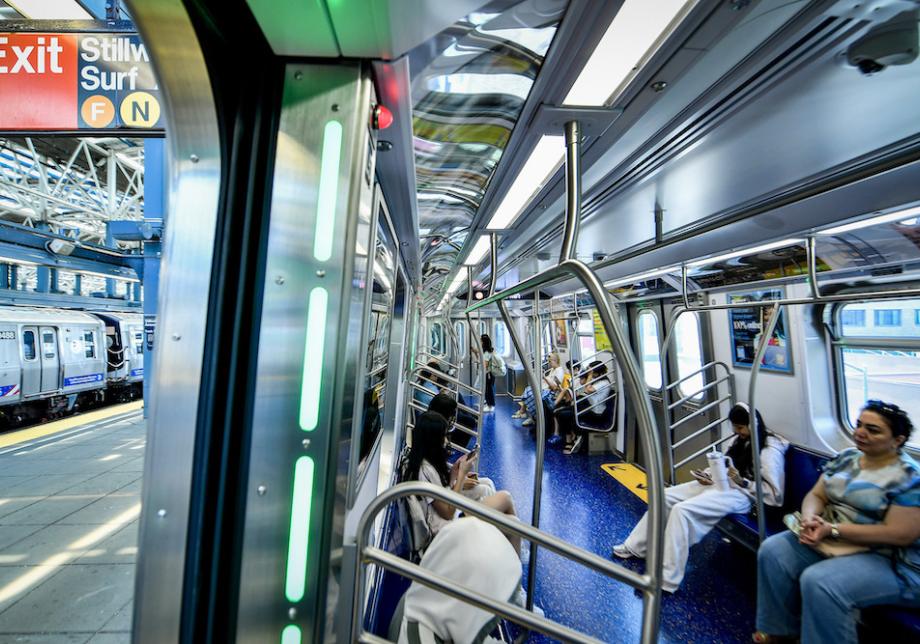
Overall subway satisfaction has increased by one point to 63%, continuing steady improvement since Spring 2024, when it was at 47%. Most key metrics remain relatively unchanged, and customer perceptions have remained stable from the Fall 2025 survey.
Nearly all on-board attributes are unchanged: satisfaction with service reliability is 62%, satisfaction with waiting times is 59%, and satisfaction with station cleanliness is 60%, all in line with Fall 2025. Customers continue to feel safe in the system: 62% feel safe on trains; 60% reported feeling safe in stations, up one point; and 54% said the same for subway platforms, also up one point from Fall 2025.
Bus
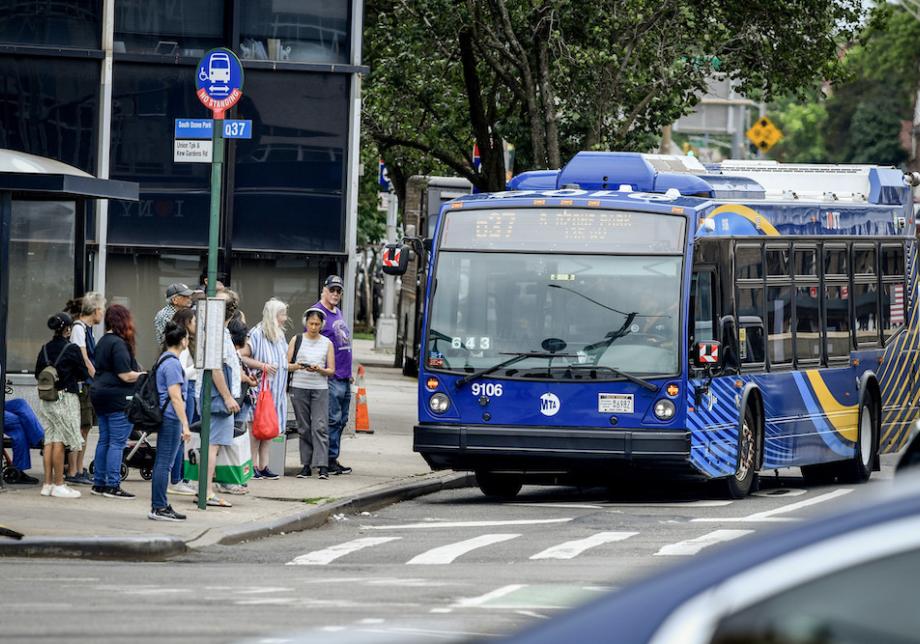
Overall Local, Limited, and Select Bus customer satisfaction is 64%, up three points from Fall 2025. Among Queens customers, who were affected by last year's Queens Bus Network Redesign, satisfaction increased five points to 67%, returning to pre-redesign levels (68% in Spring 2025). Staten Island also continues to improve, with overall satisfaction at 67%, up seven points from Fall 2025 and 12 points from Spring 2025.
Customer satisfaction increased between one and three points in all important service-related attributes, including waiting times, travel times, service reliability, and crowding. For Express buses, satisfaction is at 77%, on-par with Fall 2025 (76%).
Access-A-Ride
In Spring 2025, Access-A-Ride (AAR) switched to a separate, standalone monthly survey. This allows customers to provide feedback not only about their experience over the last month, but also about their most recent trip.
AAR recently experienced significant growth in demand, exceeding one million trips in March, April, and May 2026. Even with this increase in demand, AAR has maintained customer satisfaction scores above 70% in April and May, demonstrating its ability to deliver a consistently positive customer experience while serving record ridership.

Long Island Rail Road
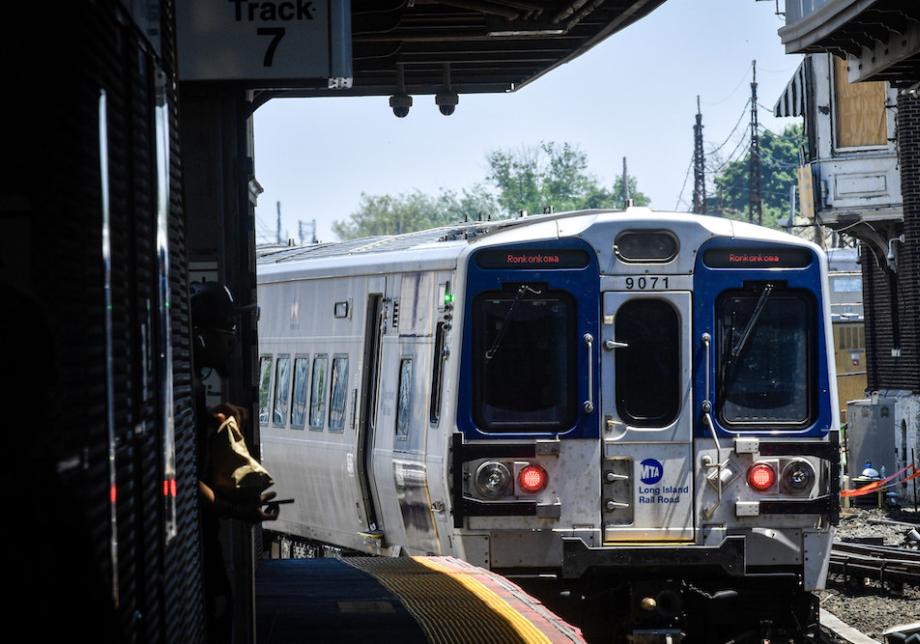
Customer satisfaction with the Long Island Rail Road is at 73%, a seven-point decrease from Fall 2025. A large portion of this decline can be attributed to customer dissatisfaction with ticket policy changes that were implemented at the beginning of 2026. Satisfaction with fare payment options saw the largest drop (82%, down five points). However, all key attributes decreased slightly: Frequency of delays saw the largest decrease, down four points to 72%. Service reliability and on-time performance, the top two drivers of satisfaction, both fell as well, to 83% and 80%, respectively.
Nine out of the 11 LIRR branches saw statistically significant decreases in customer satisfaction when compared to the Fall 2025 survey. The largest drops were:
- Babylon Branch: 67%, down eight points,
- Port Jefferson Branch: 70%, down eight points
- Ronkonkoma Branch: 69%, down seven points
- Oyster Bay Branch: 63%, down seven points
- Port Washington Branch: 79%, down six points
- Long Beach Branch: 66%, down six points
City Zone (83% down 4pts), Montauk (71% down 5pts), and Far Rockaway (76% down 5pts) saw smaller but still statistically significant decreases. Hempstead (74%) and West Hempstead (78%) are on par with Fall 2025.
Most safety attributes fell slightly, but remain quite high overall. Customers reported feeling safe from accidents on board trains (91% of respondents), and safe from crime or harassment on board (87% of respondents). Customers also largely reported feeling safe from crime or harassment in stations (80% of respondents) and parking lots (80% of respondents).
Metro-North Railroad
Metro-North continues to have high levels of satisfaction, with 79% of customers reporting being very satisfied or satisfied overall. This was a decrease of eight points from the Fall 2025 survey, driven in part by dissatisfaction with new ticket policies, similar to the Long Island Rail Road.
Satisfaction with fare payment options dropped seven points from Fall 2025, from 91% to 84%. Respondents also ranked fare payment options as a more important driver of satisfaction—from no. 14 in Fall 2025 to no. 3 in Spring 2026.
Key service attributes with the largest drops in satisfaction from Fall 2025 were on-time performance and frequency of delays, each of which decreased by five points. (The former moved from 88% to 83%, and the latter from 82% to 77%). Satisfaction with service reliability is 87%, down four points.
The Hudson Line was the highest performing line, with satisfaction at 82%. The New Haven Line decreased to 78%, down eight points. Satisfaction on the Harlem Line decreased by 10 points, from 89% to 79%, making it the line with the largest decline.